“On average, the colours in a rainbow are white.”
The Tiger That Isn’t – Seeing Through A World of Numbers
We use averages to summarise a world of complexity and boil things down into a single number, But, as when describing a rainbow as white, we can lose the essence of what we’re trying to summarise.
Managers tend to manage using averages. Look through any management information report and you will see average after average and even averages of averages! But this desire to summarise and simplify data risks losing vital information on how to improve. It’s the variation in the performance of a process that holds the potential to better understand how to improve it. It can be a potential gold-mine of opportunity.
An Example
I worked with a client who had a large team of people whose main purpose was to negotiate with someone outside the business to agree how much the company should pay for something.
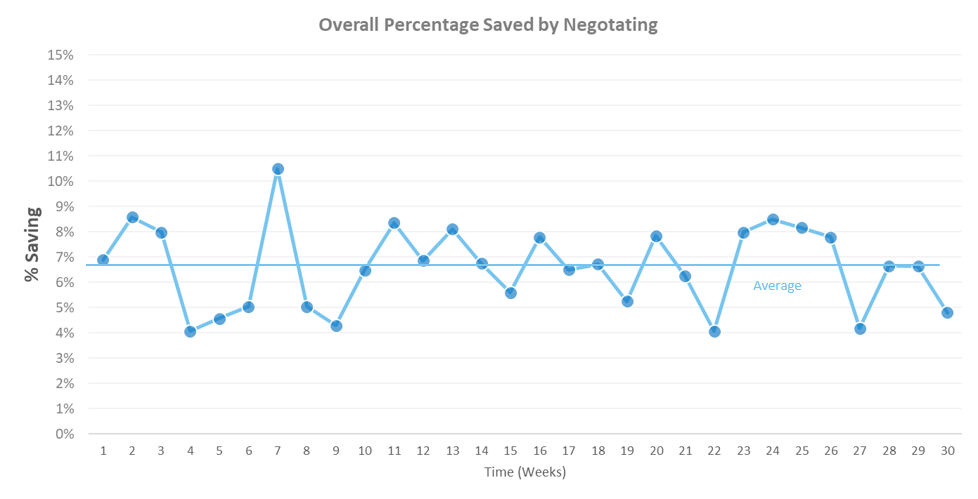
A measure was designed to track how well this group of people were negotiating. Plotting it over time showed that performance varied a bit week to week but was fairly flat at an average of just under 7%. This meant that, on average, the team were negotiating a reduction in the price of 7% from what was being asked.

This average saving rate though represented the performance of over 100 people working across several different locations. How were all these people performing individually?
The Variation Hidden by The Average
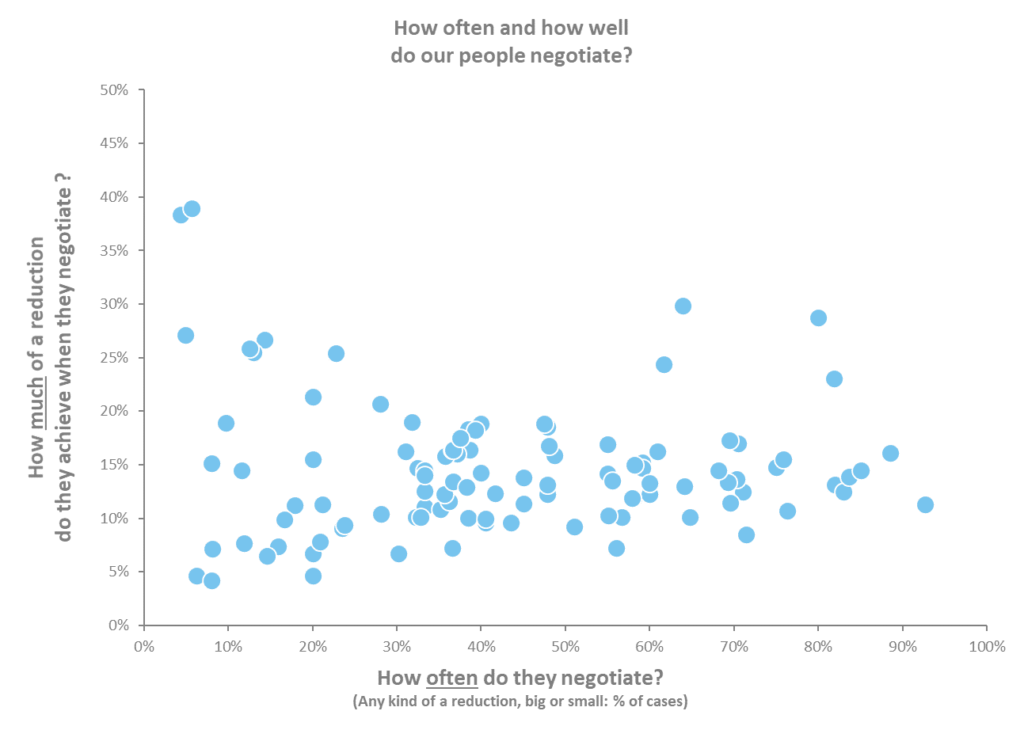
In the scatter plot below each dot shows how well each individual person is negotiating. We broke down their performance into two components to show how often each person negotiates (on the horizontal axis) and when they negotiate, how much of a reduction they achieve (on the vertical axis).
Performance looked like this:

We’ll come onto how we can interpret this chart shortly, but for now just notice how varied performance is. It looks like someone’s sneezed onto the piece of paper! Performance is all over the place. This inconsistency costs money. A lot of money.
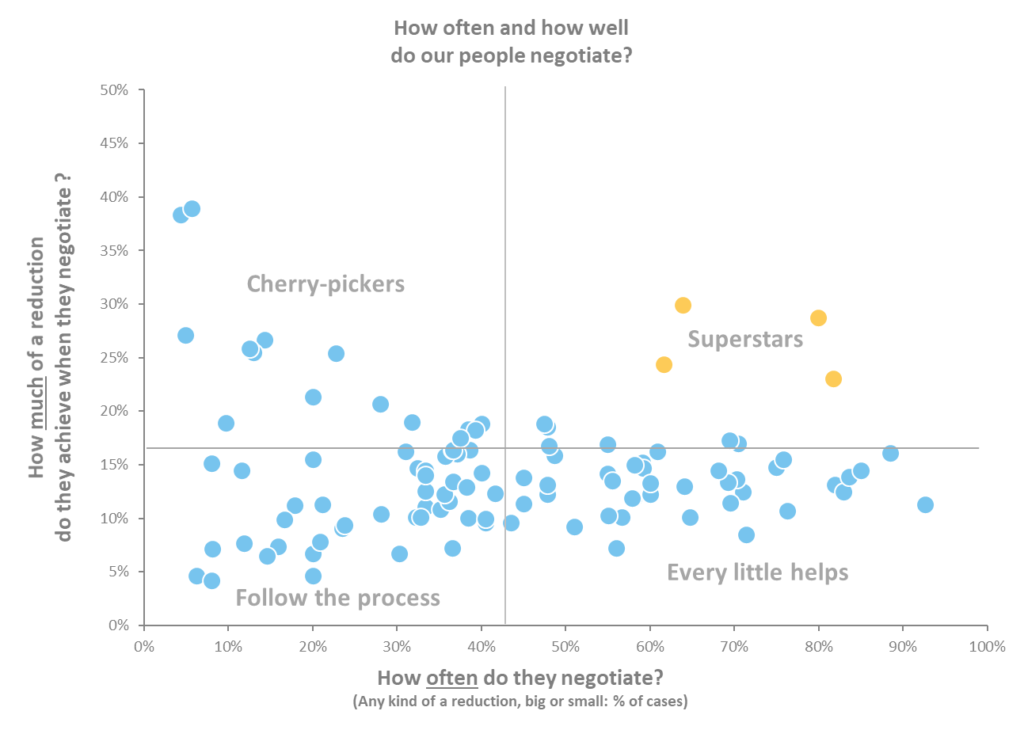
Overlaying the average performance for the whole team helps to segment people into 4 categories and to get a better feel for what’s going on:

• The “Cherry-pickers” didn’t negotiate very often but could spot when the other side was asking for too much and would challenge it.
• The “Every little helps” people negotiated most of the time but could be getting a bigger price reduction.
• The “Follow the process” people were interesting. These were people who weren’t negotiating very often or very much, but paradoxically were viewed by the management team as some of the best performers: they were scoring well in what they were measured upon – getting through lots of work and making sure they passed the quality audits! As in what you wish for, it pays to be careful what you measure – just in case you get it!
• Finally, we have the “Superstars” who appeared to be able to negotiate big reductions most of the time.
Visualising performance in this way suggested a pathway to improvement: if we could find a way to replicate what the super-stars were doing, that would be worth a lot of money.
We did.
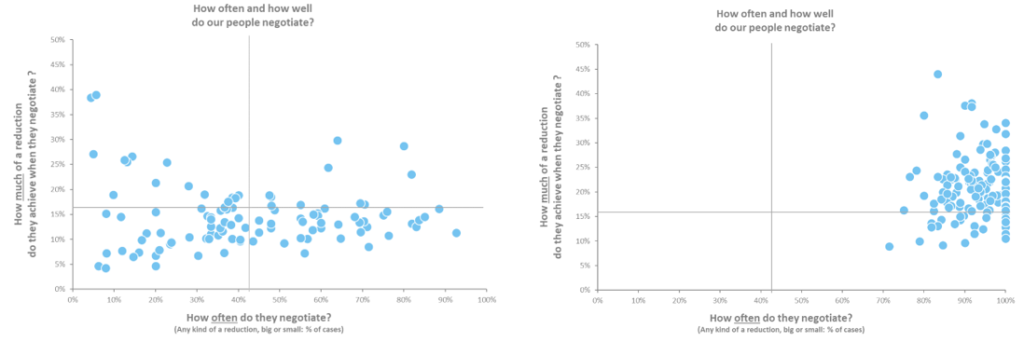
A little while later, here’s how things had changed:
Before
After

A pretty big change. Most people were now negotiating on most cases and the size of the reduction they agreed had improved too.
The amount of spend being managed through this process was in the realm of tens of millions of pounds a year. This improvement in negotiation ability delivered a multi-million-pound annual saving for this company with the benefit flowing into their bottom-line profit in year one. No IT investment was required – just clarity and focus on what mattered.
There was an added bonus too. The people doing the work told us they enjoyed their jobs more and were more engaged: they were clearer about the purpose of their role; they now had the right measures to tell them how they were doing and they enjoyed working out how to improve.
Summary
To sum up, when you see an average, think about white rainbows and what you are missing about the performance it’s supposed to be summarising.
Variation matters:
- It shows you how under control a process is
- It shows you how good performance could be
- And if you can understand and replicate what the best performers do and how they do it, the benefits can be huge.
How much variation do you have in a process that really matters to your business?


 How To Do More with Less